
Business Analytics
How a roofing group went from running blind to real-time profit visibility
Specialty Designer Roofing, a multi-branch operator, had its data trapped in QuickBooks and its CRM — but no real view of profit. Ephraim Solutions built a business-analytics platform that gives everyone, from the CEO to a branch GM, the same live numbers — down to what each individual job truly costs.
Client Impact
Inside the platform: the executive P&L, branch benchmarking map, and rep leaderboard. Shown with representative demo data.
Profit visibility
Real-time
live P&L across every branch, updated as jobs move
Cost detail
Per job
true cost and margin on each individual job
Benchmarking
Like-for-like
every branch measured on one national standard
The Challenge
Specialty Designer Roofing knew it was profitable. What it couldn't tell you was where the profit came from. All of the data lived in QuickBooks and across the company's CRMs, but none of it rolled up into a real view of performance — so leadership was steering on instinct.
No one could say what an individual job actually cost, or flag when a job wasn't profitable and why. And because every branch tracked things its own way, there was no honest way to compare one branch against another.
At a multi-branch, nationwide scale, that meant the biggest decisions — pricing, staffing, where to invest — were being made without the numbers to back them.
Our Approach
Ephraim Solutions unified the data trapped in QuickBooks and the CRMs into a single analytics platform — then defined, with the company, what profitability actually means: the rules, the benchmarks, and which items belong in which categories. That shared definition is what makes every number comparable.
The analytics platform gives every level of the business the same numbers:
Unified Data Layer — QuickBooks and CRM data pulled together into one model, so every number traces back to the same source.
Executive & Branch Views — a 30,000-foot company view for the CEO and a detailed branch view for every GM, drawn from the same data.
National Benchmarks & Rules — company-wide profitability rules, benchmarks, and category definitions so branches are measured on one standard.
Job-Level P&L — profitability down to the individual job, so an unprofitable job — and the reason why — is visible early.
Working with finance and branch leadership, Ephraim defined the standard first, then built the platform around it — rolling detailed and executive views out across the branch network.
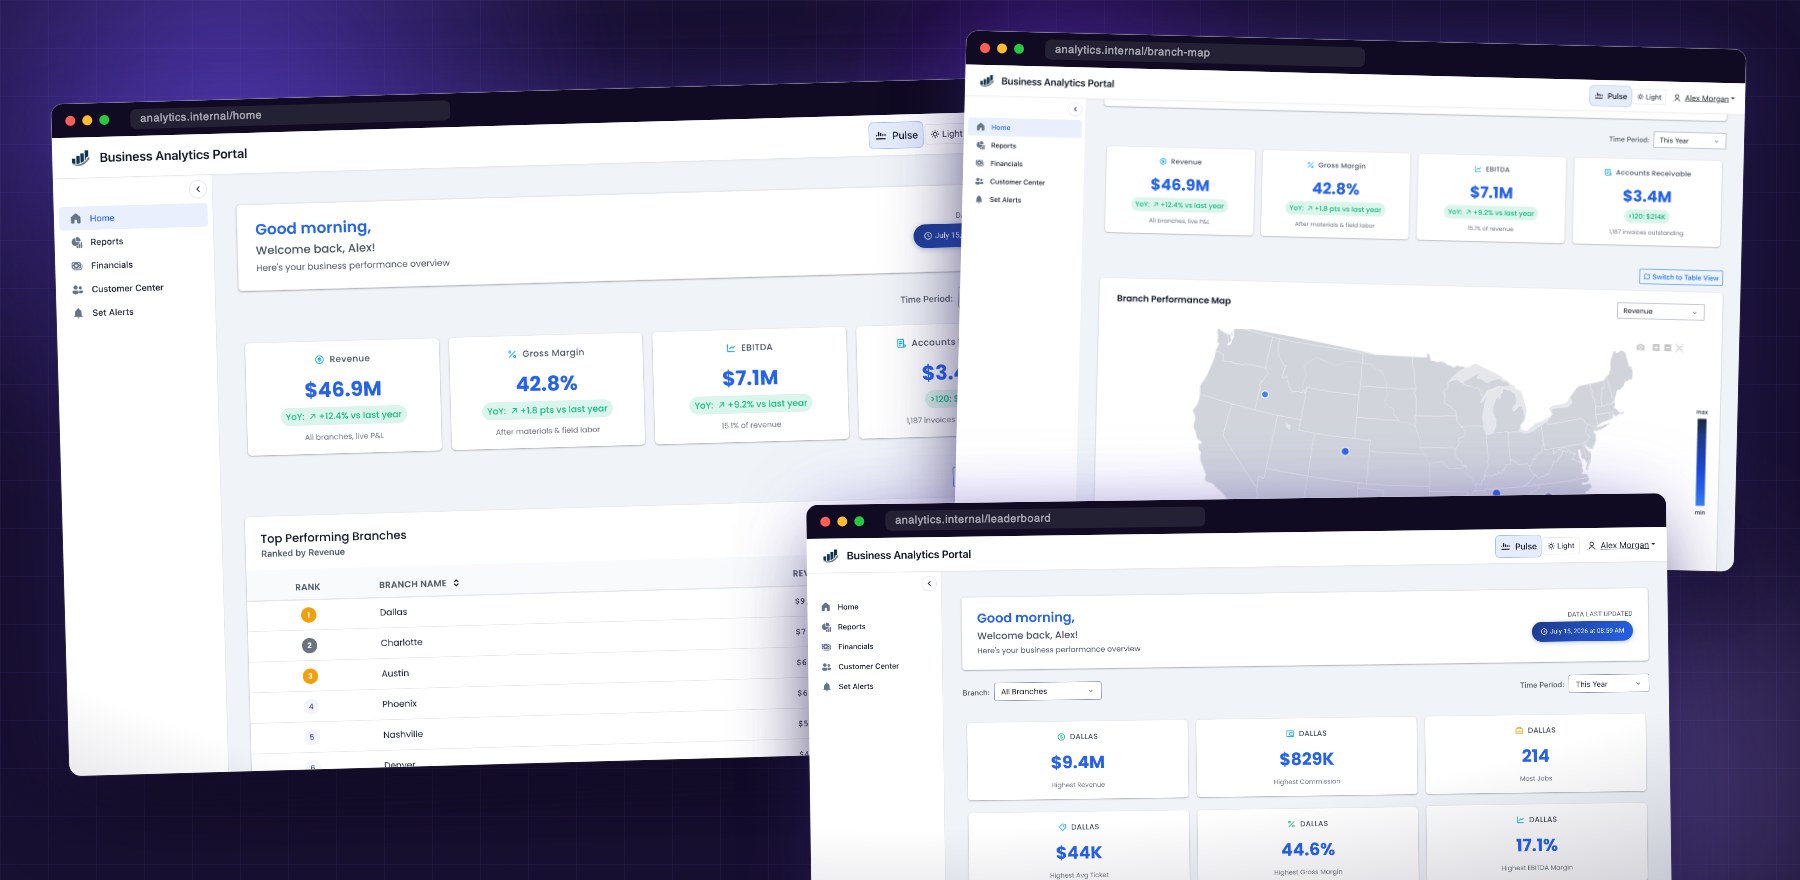
The platform across the business: executive view, branch map, and leaderboard — the same numbers at every level.
For the first time, every branch manager and I are looking at the same numbers, defined the same way. The conversation changed from 'I think' to 'here's exactly where we stand.'
Jack Cella, Specialty Designer Roofing
The Result
The CEO can now see exactly how the whole company is performing from a single view, while a GM in Alaska sees precisely how their branch is doing — against real benchmarks. And because cost is now visible at the job level, an unprofitable job gets caught while it is still running, not discovered months after it closed.
Every GM can sit down with the CFO and have a numbers conversation grounded in the same figures. Profit is no longer a feeling; it is a job-level fact, visible in real time.
✓
Real-time profit visibility across every branch
✓
True cost and margin visible on every individual job
✓
Unprofitable jobs caught early, not after they close
✓
One national standard for like-for-like comparison
With the analytics platform live across the network, the group is extending it with new benchmarks and metrics as leadership sharpens how it measures performance.
Engagement led by Bec Chamberlain, Ephraim Solutions.